Introduction
Cryptocurrency trading has become increasingly popular in recent years, attracting both seasoned investors and newcomers to the financial world. If you’re interested in delving into the world of crypto trading, understanding how to read crypto trading charts and patterns is essential. These charts provide valuable insights into the market’s behavior, helping traders make informed decisions and maximize their profits. In this comprehensive guide, we will explore various chart types, patterns, and indicators to equip you with the knowledge needed to navigate the crypto market successfully.
Why are Crypto Trading Charts Important?
Understanding how to read crypto trading charts is crucial for making informed decisions in the volatile crypto market. These charts provide a visual representation of the price movements of various cryptocurrencies over time. By analyzing historical price data, traders can identify patterns, trends, and potential trading opportunities. Crypto trading charts help traders determine the optimal entry and exit points for their trades, manage risk, and gain insights into market sentiment.
Types of Crypto Trading Charts
Line Charts

One of the simplest and most commonly used types of crypto trading charts is the line chart. Line charts plot the closing prices of a cryptocurrency over a specific period, forming a continuous line. They provide a clear overview of the price trend and are ideal for beginners to grasp the basic price movement of a cryptocurrency.
Candlestick Charts
Candlestick charts are highly popular among crypto traders due to their ability to convey a wealth of information in a single chart. Each candlestick represents a specific time period, displaying the opening, closing, high, and low prices. The body of the candlestick is filled or hollow, indicating whether the closing price was higher or lower than the opening price. Candlestick charts reveal valuable insights into price volatility, support and resistance levels, and market sentiment.

Bar Charts
Bar charts are similar to candlestick charts but display price information in a different format. Each bar represents a specific time period and provides information about the opening, closing, high, and low prices. The top of the bar represents the high, while the bottom represents the low. A horizontal line on the left side denotes the opening price, and a horizontal line on the right side represents the closing price. Bar charts offer a comprehensive view of price movements and are useful for technical analysis.
Key Charting Elements
Support and Resistance Levels
Support and resistance levels are crucial elements in chart analysis. Support levels represent price levels where buying pressure is strong enough to prevent the price from declining further. Resistance levels, on the other hand, are price levels where selling pressure is significant, preventing the price from rising higher. Identifying these levels helps traders make decisions about entry, exit, and stop-loss orders.
Trend Lines
Trend lines are lines drawn on a chart to connect the highs or lows of an asset’s price movement. They help identify the direction of the trend and potential areas of support or resistance. Upward-sloping trend lines indicate an uptrend, while downward-sloping trend lines indicate a downtrend. Trend lines provide valuable insights into the overall market sentiment.
Volume Analysis
Volume refers to the number of shares or contracts traded in a given period. Analyzing volume alongside price movements helps traders assess the strength of a trend or potential trend reversals. High volume during price increases or decreases indicates significant market interest, while low volume suggests a lack of conviction. Volume analysis is a crucial component of chart analysis and helps confirm the validity of price movements.
Common Crypto Trading Patterns
Head and Shoulders
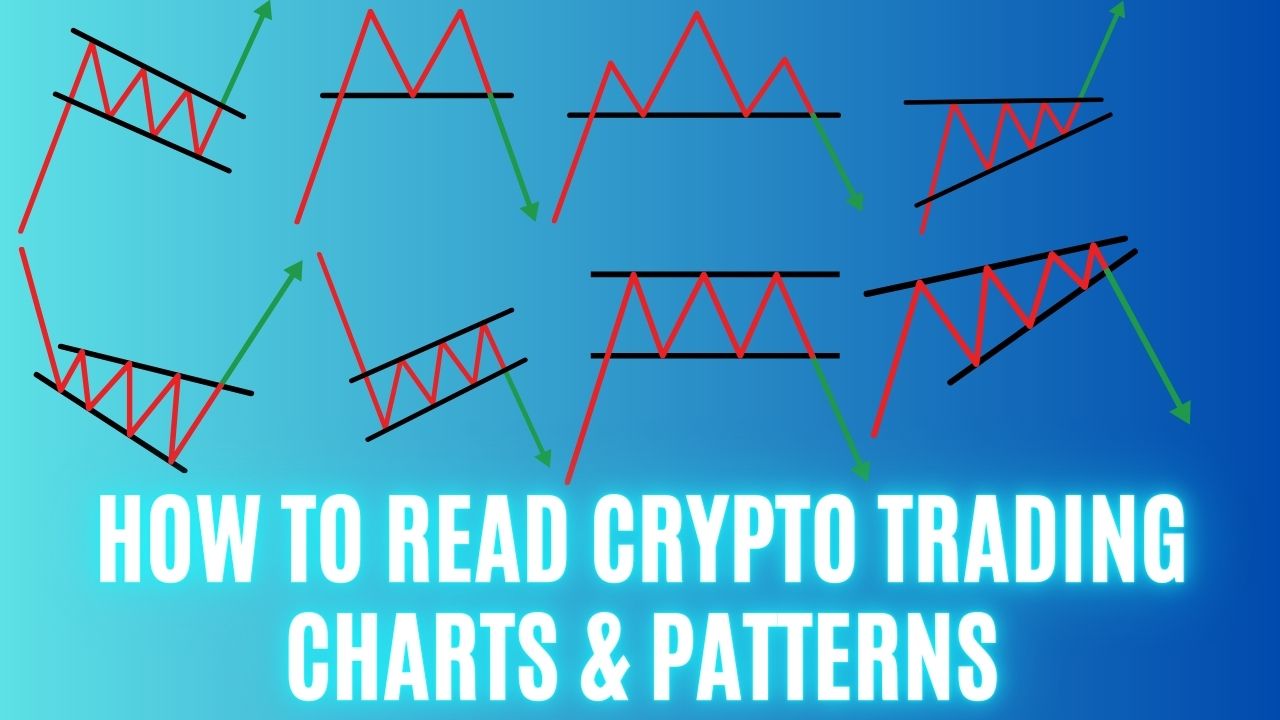
The head and shoulders pattern is a widely recognized reversal pattern in chart analysis. It consists of three peaks, with the middle peak (the head) being higher than the other two (the shoulders). This pattern suggests a potential trend reversal from bullish to bearish and provides traders with an opportunity to enter short positions.
Double Bottom
The double bottom pattern is a bullish reversal pattern that appears after a downtrend. It consists of two consecutive troughs of approximately the same depth, separated by a peak. The pattern indicates a potential trend reversal from bearish to bullish and presents an opportunity for traders to enter long positions.
Ascending Triangle
The ascending triangle pattern is a continuation pattern often seen during an uptrend. It is formed by a horizontal resistance line and an upward-sloping trend line. The pattern suggests that buyers are gradually gaining strength, and a breakout above the resistance line may lead to further upward movement. Traders often look for this pattern as a potential buying opportunity.
Using Indicators in Chart Analysis
Moving Averages
Moving averages are popular indicators used in chart analysis to identify trends and potential entry and exit points. They smooth out price fluctuations and provide a clearer picture of the overall trend direction. The two commonly used moving averages are the Simple Moving Average (SMA) and the Exponential Moving Average (EMA). Traders often look for crossovers between different moving averages to signal potential buying or selling opportunities.
Relative Strength Index (RSI)
The Relative Strength Index (RSI) is a momentum oscillator that measures the speed and change of price movements. It oscillates between 0 and 100 and helps traders identify overbought and oversold conditions in the market. A reading above 70 indicates overbought conditions, suggesting a potential reversal or correction, while a reading below 30 indicates oversold conditions, signaling a potential upward price movement.
Bollinger Bands
Bollinger Bands consist of three lines plotted on a price chart: the upper band, the lower band, and the middle band (which is usually a simple moving average). Bollinger Bands help traders assess price volatility and identify potential price breakouts. When the price touches or crosses the upper band, it suggests overbought conditions, while touching or crossing the lower band indicates oversold conditions. Traders often look for price reversals when the price moves beyond the bands.
FAQs
What are the advantages of using candlestick charts in crypto trading?
Candlestick charts offer several advantages in crypto trading. They provide visual cues about market sentiment, such as bullish or bearish patterns. Candlestick patterns can indicate potential trend reversals or continuation, helping traders make informed decisions. The information displayed in candlestick charts, including the opening, closing, high, and low prices, provides a comprehensive view of price movements.
How can I use moving averages to determine entry and exit points?
Moving averages can be used to determine entry and exit points in crypto trading. When a shorter-term moving average crosses above a longer-term moving average, it may signal a buying opportunity, known as a bullish crossover. Conversely, when the shorter-term moving average crosses below the longer-term moving average, it may indicate a selling opportunity, known as a bearish crossover.
What is the significance of volume in chart analysis?
Volume plays a vital role in chart analysis as it provides insights into market participation and the strength of price movements. Higher volume during price increases or decreases indicates significant market interest and validates the price movement. Lower volume during consolidations or sideways movements suggests a lack of conviction and potential trend reversals.
How can I spot potential reversal patterns in crypto trading?
To spot potential reversal patterns, pay attention to chart patterns such as head and shoulders, double tops, or double bottoms. These patterns indicate a potential trend reversal and provide traders with opportunities to enter or exit positions. Additionally, using indicators like the RSI or Bollinger Bands can help identify overbought or oversold conditions, suggesting a possible reversal.
What are the main drawbacks of relying solely on chart analysis?
While chart analysis is a valuable tool for making trading decisions, it has some limitations. Price movements in the crypto market can be influenced by various factors beyond technical analysis, such as news events or market sentiment. Relying solely on chart analysis may not capture the full picture and could lead to missed opportunities or false signals. It is essential to combine chart analysis with fundamental analysis and stay informed about market news.
Conclusion
Understanding how to read crypto trading charts and patterns is essential for successful trading in the cryptocurrency market. By analyzing various chart types, recognizing patterns, and using indicators, traders can gain valuable insights into price movements, identify trends, and make informed trading decisions. However, it’s crucial to remember that chart analysis should be complemented with other forms of analysis and risk management strategies. Continuously learning and adapting to the ever-changing crypto market will enhance your trading skills and increase your chances of success.

